- Hypocenter Relocation Using the Master Station Method
Honn Kao
Institute of Earth Sciences, Academia Sinica, Nankang, Taipei, Taiwan, ROC
Rong-Yuh Chen and Chien-Hsin Chang
Seismology Center, Central Weather Bureau, Taipei, Taiwan, ROC
also in Institute of Geophysics, National Central University, Chung-Li, Taiwan, ROC
(submitted to TAO Chi-Chi Earthquake Special Issue, March 1, 2000, revised June 10, 2000)
Abstract.
The Chi-Chi earthquake that occurred in central west Taiwan is one of the
most well-recorded large earthquakes in the world. Consequently,
one should be able to reliably locate the point of nucleation from the
impulsive onsets on short-period seismograms. But in fact, the hypocentral
locations reported by various agencies are different. Our approach
is to relocate the Chi-Chi mainshock with the most unambiguous arrival
readings and a 3-D velocity structure using the Master Station (MS) method.
In addition to the usage of a reasonalbe 3-D velocity model, the MS method
is superior in two aspects: it is unaffected by the nonlinear nature of
traditional earthquake locating process and does not have the trade-off
problem between the focal depth and the assumed origin time. Our
results indicate that the best solution of hypocenter always converges
to 23.86±0.01°N, 120.81±0.01°E, and depth of 10 km, no matter which
initial conditions are adapted. This location is essentially the
same as that later refined by CWB using a combined dataset of both arrivals
on short-period seismograms and S-P time intervals measured from
near-source strong-motion records. An important implication of our
study is that reliable hypocenter can be derived using as few as 10 accurately
determined arrival times from nearby short-period stations when a reasonable
3-D velocity model and the MS method are used in the hypocenter determination.
Thus, the performance of CWB RTD system, which is already the leading example
of its kind, can be further improved in the near future.
1.
Introduction
Hypocentral
location is a fundamental parameter in earthquake study.A mislocated hypocenter
can cause great uncertainties in many aspects, including the calculations
of travel times, epicentral distances, epicentral azimuths and back azimuths…etc.Consequently,
studies which depend on these parameters may be significantly affected
and can sometimes result in erroneous interpretations (e.g., Kao and Chen,
1991).
Because
an earthquake fault is of finite dimension, it is sometimes very difficult
to associate a particular location as the hypocenter.This is especially
true for large earthquakes whose fault dimension can be much larger than
the wavelength of the recorded P or S phases (e.g., Billings
et al., 1994).For examples, the hypocenter determined from short-period
seismograms usually corresponds to the initial phase (or nucleation) of
an earthquake rupture, whereas the one from long-period waveforms is associated
with the average (or centroid) location of the seismic moment release.For
small and moderate-sized events, the rupture dimension is very limited,
often on the order of a few km or less (e.g., Kanamori, 1978; Sacks and
Rydelek, 1995), such that there is no distinguishable difference between
locations of initial rupture and centroid. For large earthquakes, on the
other hand, the location of initial rupture can significantly deviate from
the centroid hypocenter. Depending on the distribution of seismic moment
release, the difference sometimes can be as much as several tens of km.
The
Chi-Chi earthquake is a very big event along with more than 80 km of surface
rupture (Figure 1). Thus, it is expected to have a
noticeable difference between the locations of rupture nucleation and centroid.
On the other hand, one should be able to reliably locate the point of nucleation
from short-period seismograms because of the sharp onsets associated with
the earthquake's large magnitude. But in fact, there are some differences
among the hypocentral locations reported by various agencies, including
the Seismology Center of the Central Weather Bureau (CWB), the U.S. Geological
Survey (USGS), and the Harvard University. Which one is the closest to
the true nucleation point of the Chi-Chi mainshock? Given the fact that
the Chi-Chi earthquake is the most well-recorded (and probably will also
be the most well-studied) large event in the Taiwan region, the above question
deserves a detailed investigation.
It
is well known that mislocation of earthquakes can happen if the complex
velocity structure is represented by a simple one in the determination
of earthquake hypocenters (e.g., Billings et al., 1994; Chiu et al., 1997).
So far, all the reported hypocenters for the Chi-Chi earthquake are determined
assuming horizontal-layered velocity models. In this study, we try to relocate
the Chi-Chi mainshock using unambiguous arrival phases and a three-dimensional
(3-D) velocity model (Rau and Wu, 1995). The Master Station (MS) method
(Zhou, 1994), which depends on the differential travel times among different
stations but not the assumed earthquake origin time, is used in the relocation
process. Tests with various subsets of arrival time data are also performed
to evaluate the robustness of our results.
2.
Reported Hypocenters by Various Agencies
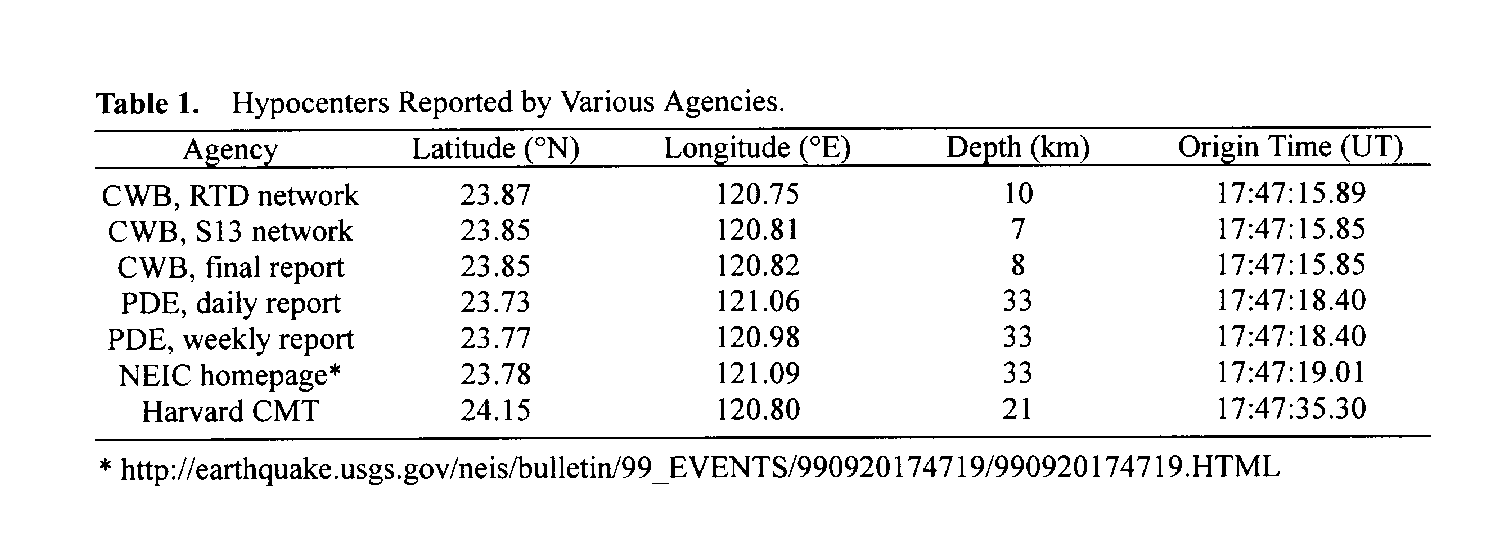
Table
1 and Figure 1 summarize the locations of hypocenters
reported by various agencies for the Chi-Chi mainshock.The first report
was from the Taiwan Rapid Earthquake Information Release System of CWB
(RTD; Wu et al., 1998), which located the epicenter at 23° 52.2'N, 120°
45.00'E, with a depth of 10 km. Because the resolution of epicentral determination
depends heavily on the inter-station spacing which is in the order of ~5
km (Shin et al., 2000), it becomes less meaningful to list the epicenter
with units <1 km (~0.009°). Therefore, we will limit the spatial resolution
in our discussion to one hundredth of a degree hereafter.
Using
data from the short-period (S13) seismographic network, CWB later revised
the epicenter to 23.85°N, 120.81°E – about 5 km to the east of the original
report. The focal depth was slightly changed from 10 km to 7 km (Shin et
al., 2000). CWB issued the final report at 23.85°N, 120.82°E, with a
depth of 8 km, using combined data from both the strong-motion and short-period
weak-motion networks.
The
epicenter listed in the daily report of the Preliminary Determination of
Epicenters (PDE) of USGS, which is based on data from global networks,
is at 23.73°N, 121.06°E. PDE later shifted the epicenter to 23.77°N,
120.98°E in its weekly report (both the daily and weekly reports are available
from the ftp server of the Data Management Center of IRIS). In the homepage
of the National Earthquake Information Center (NEIC) of USGS that contains
information of all large earthquakes occurred in 1999, the epicenter is
listed as 23.78°N, 121.09°E (Table 1).The focal
depth of 33 km in all PDE's reports should not be considered as the true
depth, but an indication of shallow earthquakes due to the insufficient
resolution of the inversion algorithm (Sipkin, 1982).
On
the other hand, the epicenter reported by the Harvard University, 24.15°N,
120.80°E, is some 30–40 km north of those reported by CWB and USGS. Such
a discrepancy is well expected because the location of epicenter is parameterized
in the Harvard CMT inversion algorithm (Dziewonski et al., 1981) and presumably
corresponds to the centroid of seismic moment release, not the rupture
nucleation point. This is also consistent with many preliminary studies
showing similar distance interval between the locations of initial rupture
and the largest seismic slip (e.g., Chen and Zeng, 1999; Kao and Chen,
2000; Ma et al., 1999).
3.
Three-dimensional Relocation: Master Station (MS) Method
Our
approach is to relocate the Chi-Chi earthquake with the most unambiguous
arrival readings and a 3-D velocity structure. Here, we briefly describe
the MS method used for such a task. In a nutshell, the advantage of MS
method is its capability of locating an earthquake within a given velocity
model (certainly including a very complex 3-D one) without frequent recalculation
of ray paths and travel times, which turns out to be the most time-consuming
process (Zhou, 1994).
The conventional way of locating an earthquake is to minimize the sum of square of the residual between the calculated and observed travel times across the seismic network, i.e.,
E(r)
= S ( wj dtj )2, j=1…N(1)
dtj
= Tj - (t(r) + To)(2)
where wj
is the weighting factor for station j depending on the quality of
data, Tj is the observed arrival time at station j,
tj(r)
is
the calculated travel time for station
j assuming the hypocenter
is at r, and To is the assumed origin time.
There
are two major weaknesses associated with the method described above.First
of all, because E(r) is a measure of the variance of the
residuals which depends on both the location of the hypocenter and the
origin time, there is a significant trade-off between the two parameters
(e.g., Christensen and Ruff, 1985; Zhou, 1994).The second is that the process
is highly nonlinear with respect to the variation of hypocentral coordinates.Thus,
there is always a possibility that the inversion is trapped by a local
minimum.
The trade-off problem is eliminated in the MS method because it determines the hypocenter using the concept of equal differential time (EDT) surfaces.An EDT surface is defined as
Sjk = Tj - Tk = tj(r) - tk(r)(3)
if and only if the
assumed location of hypocenter, r, is indeed the true location.Therefore,
in the process of searching for the best location that satisfies (3), there
is no need to assume an origin time.
To
avoid the nonlinearity problem, the MS method determines the best solution
in a forward sense.It is clear that implementing the MS method depends
critically on the algorithm that determines the travel times between seismic
stations and an assumed hypocenter. Given the computing power of today's
workstations, it is not practical to recalculate all the ray paths through
a 3-D velocity model in a forward grid search. On the other hand, workstation's
input/output (I/O) speed is quite sufficient for searching through a very
large database stored on line. Therefore, the first task in the MS method
is to systematically calculate the travel times and paths from a set of
stations to all the grid points within a given 3-D velocity model and then
stores the results on fast I/O hard disks, known as the reference files
(Moser, 1991; Zhou, 1994). In other words, the MS method takes advantage
of computer's fast I/O performance and big capacity of storage in exchange
for computation time later.
In practice, once a set of N observed arrival times is inputted, (N-1)
EDT surfaces will be formed and the pre-stored travel-time and ray path
reference files will be searched to find out the location(s) passed by
the largest number of EDT surfaces. Then the immediate neighborhood of
these preliminary locations is searched in grid to find out the best solution
that satisfies equation (3). Readers are referred to Moser (1991) and Zhou
(1994) for more technical details.
4.
Three-dimensional Relocation: Results
Table
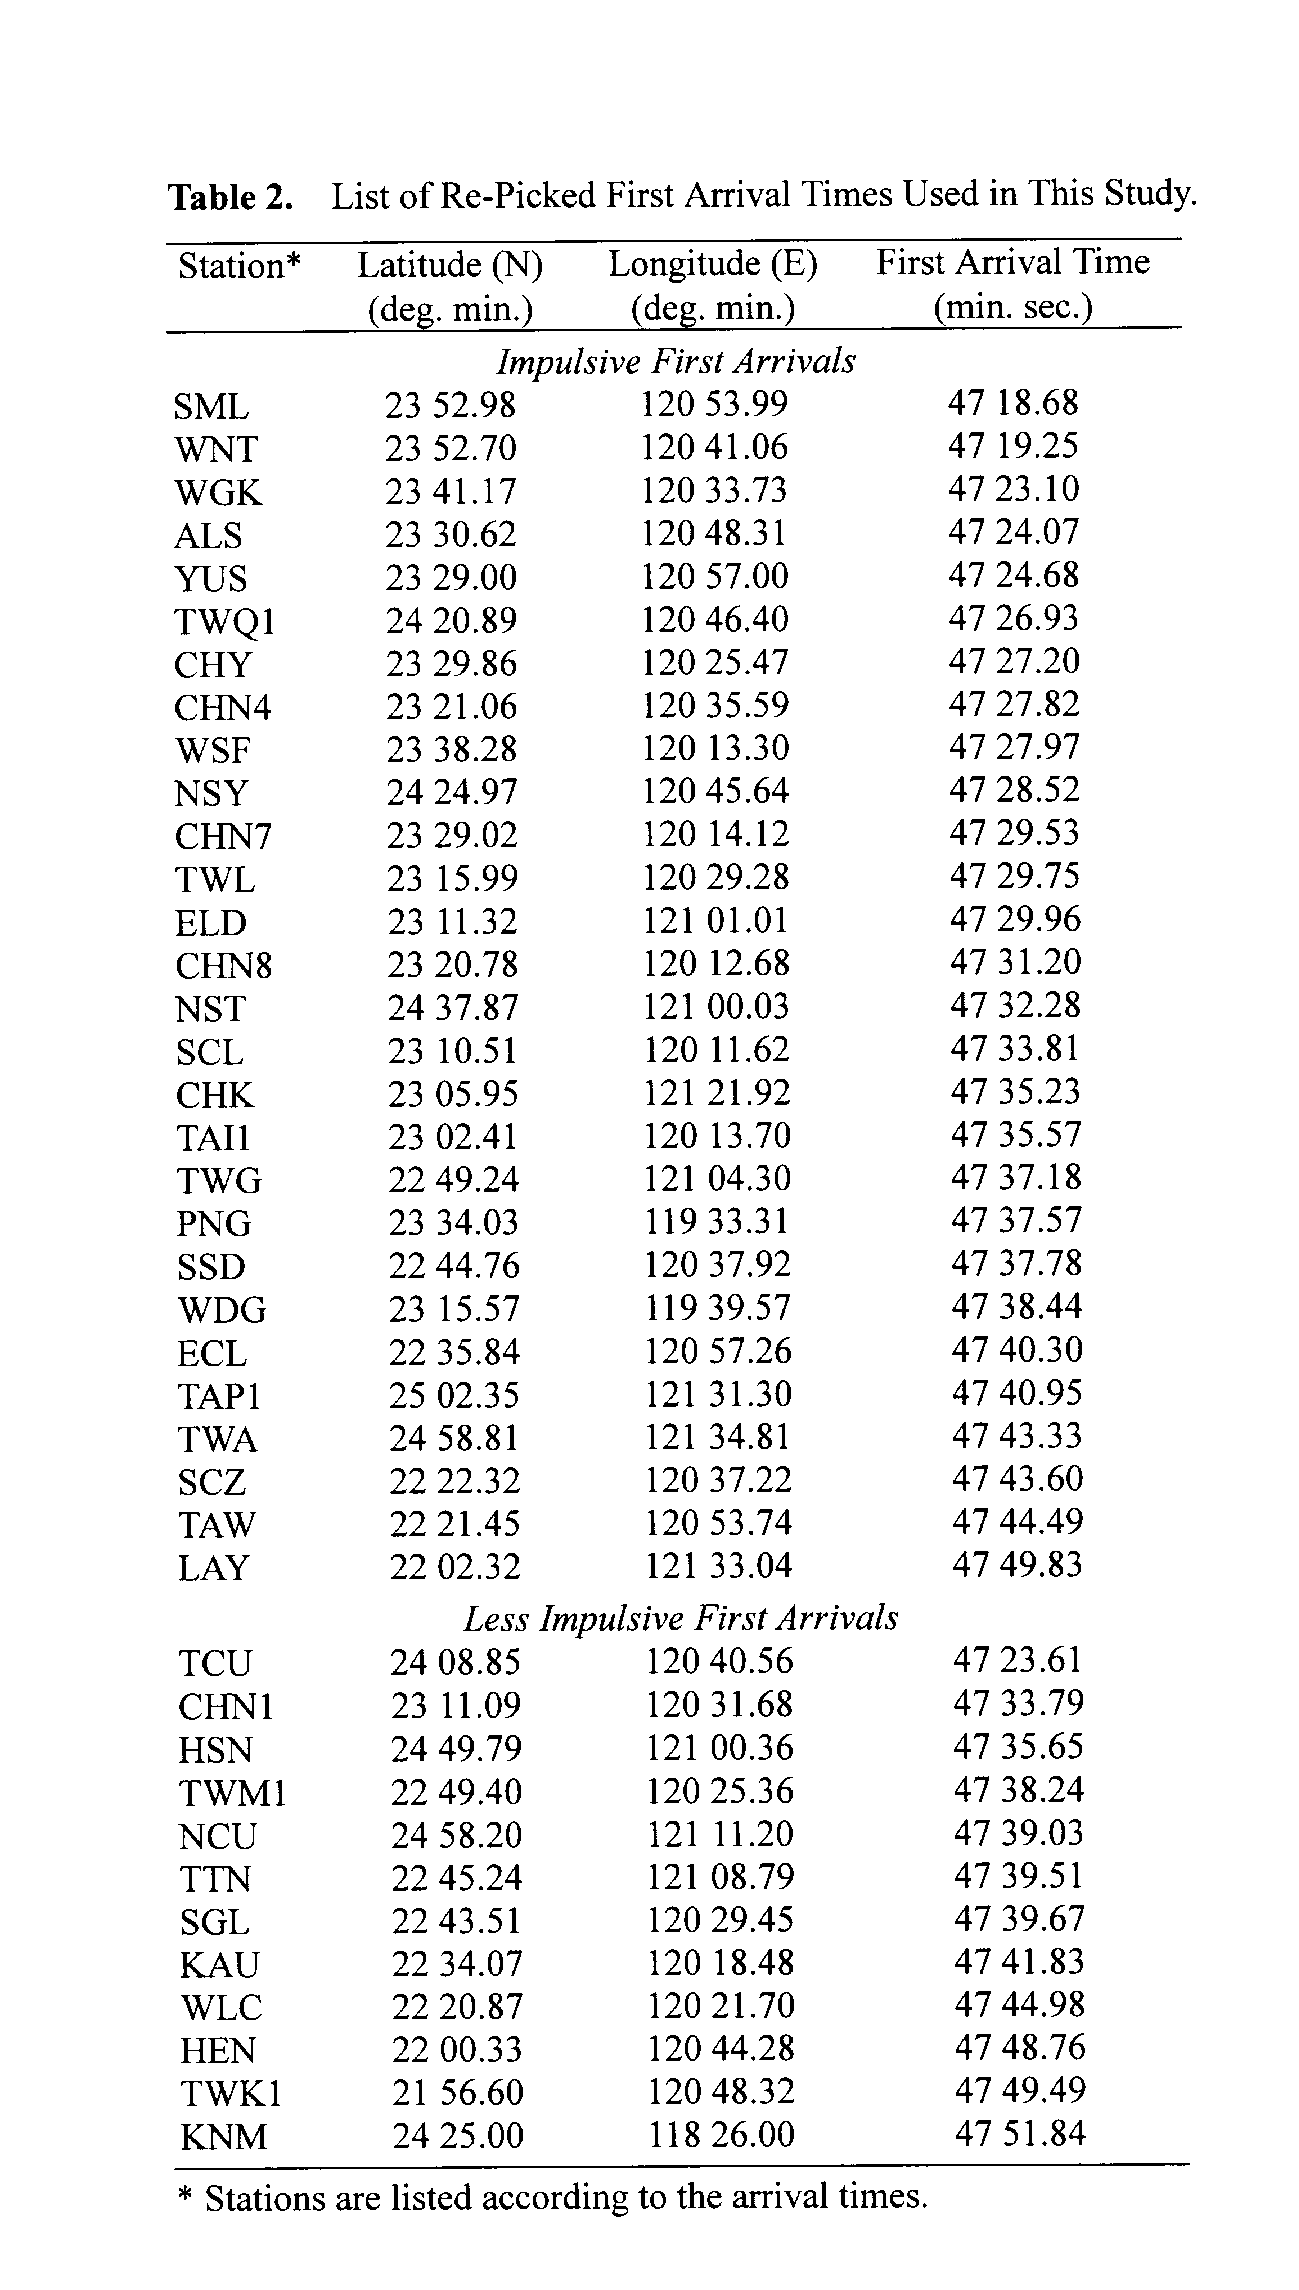
2 is a list of P arrival times that are used in this study.
We have personally re-picked all the first arrivals to ensure the highest
accuracy. The list is grouped into two categories: one with stations showing
impulsive first arrivals such that the identification of the arrival time
is unambiguous, and the other with less impulsive first arrivals. Typical
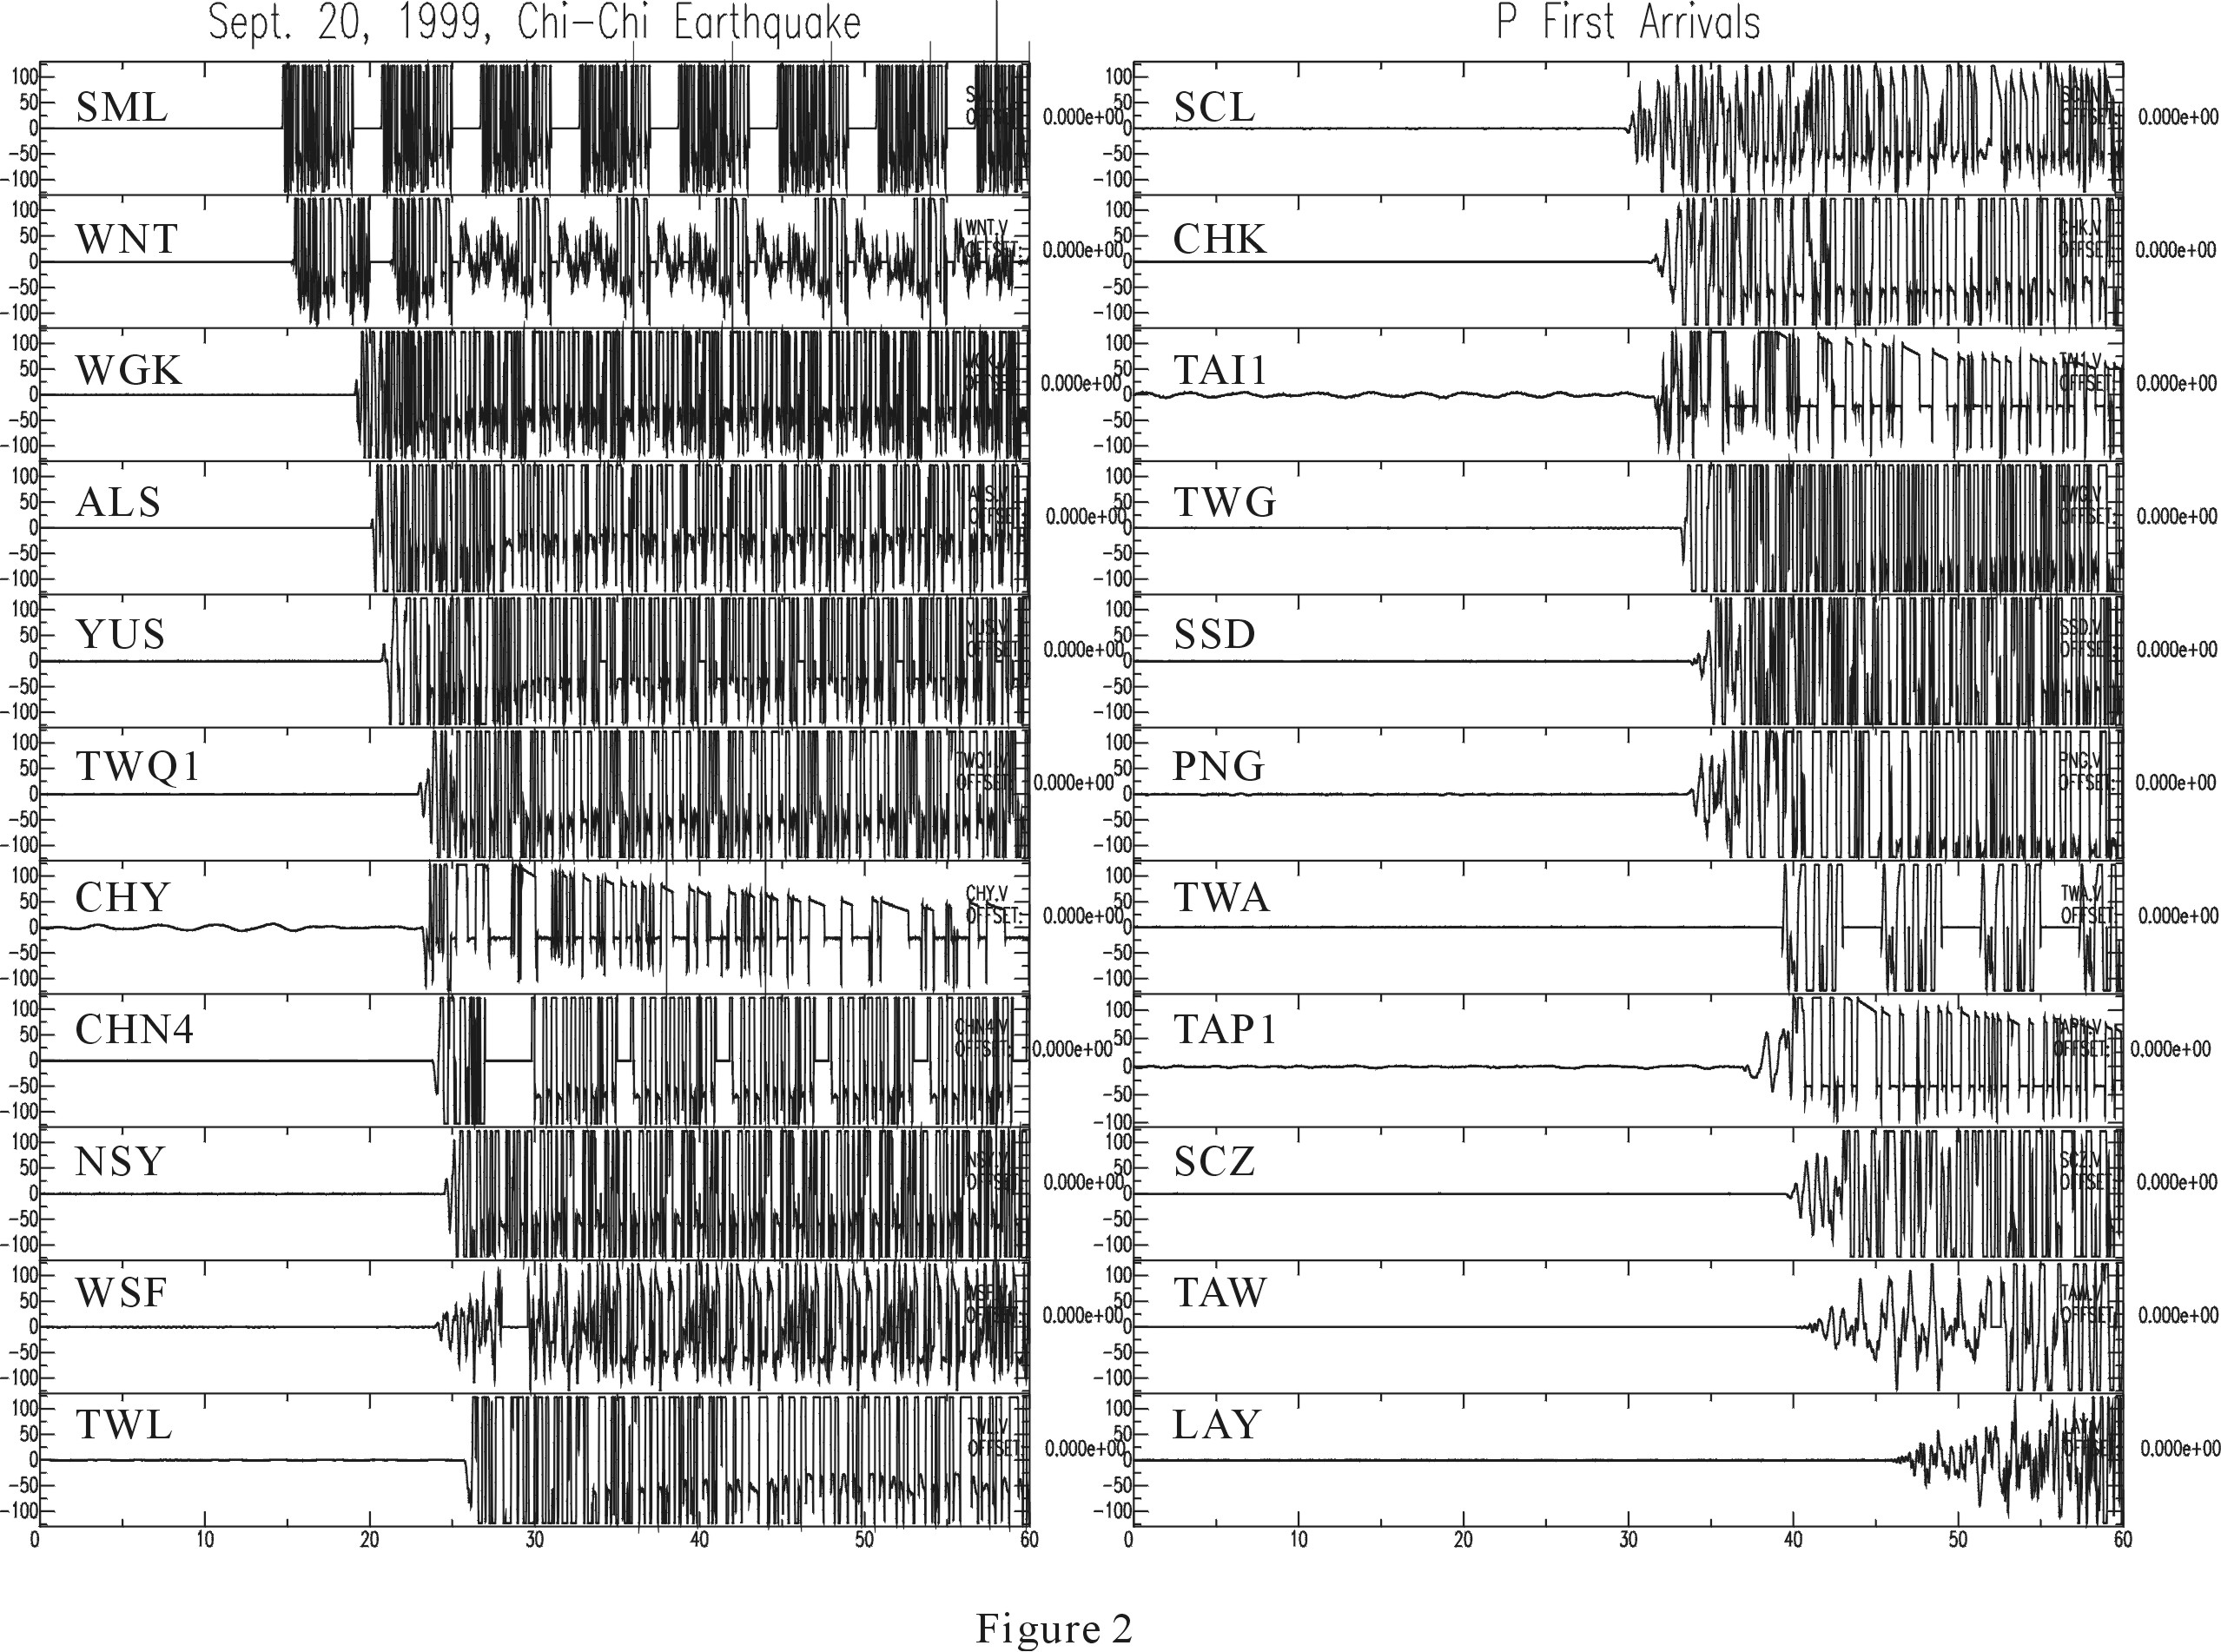
examples of seismograms are shown in Figure 2.
Due
to our insufficient knowledge of the true 3-D velocity model, it is anticipated
that stations far away from the epicenter would correspond to larger travel
time uncertainties. Previous studies also indicated that, under a couple
of specific conditions, a hypocenter determined from a smaller dataset
may actually be closer to the true location than that from a larger one
(Tsai and Wu, 1997). Such conditions include (1) the velocity structure
is very complex and (2) the stations forming the smaller dataset are all
within a short distance from the true epicenter. Consequently, we have
performed 3-D relocation with various numbers of stations to see if there
is any systematic bias in the dataset used in this study.
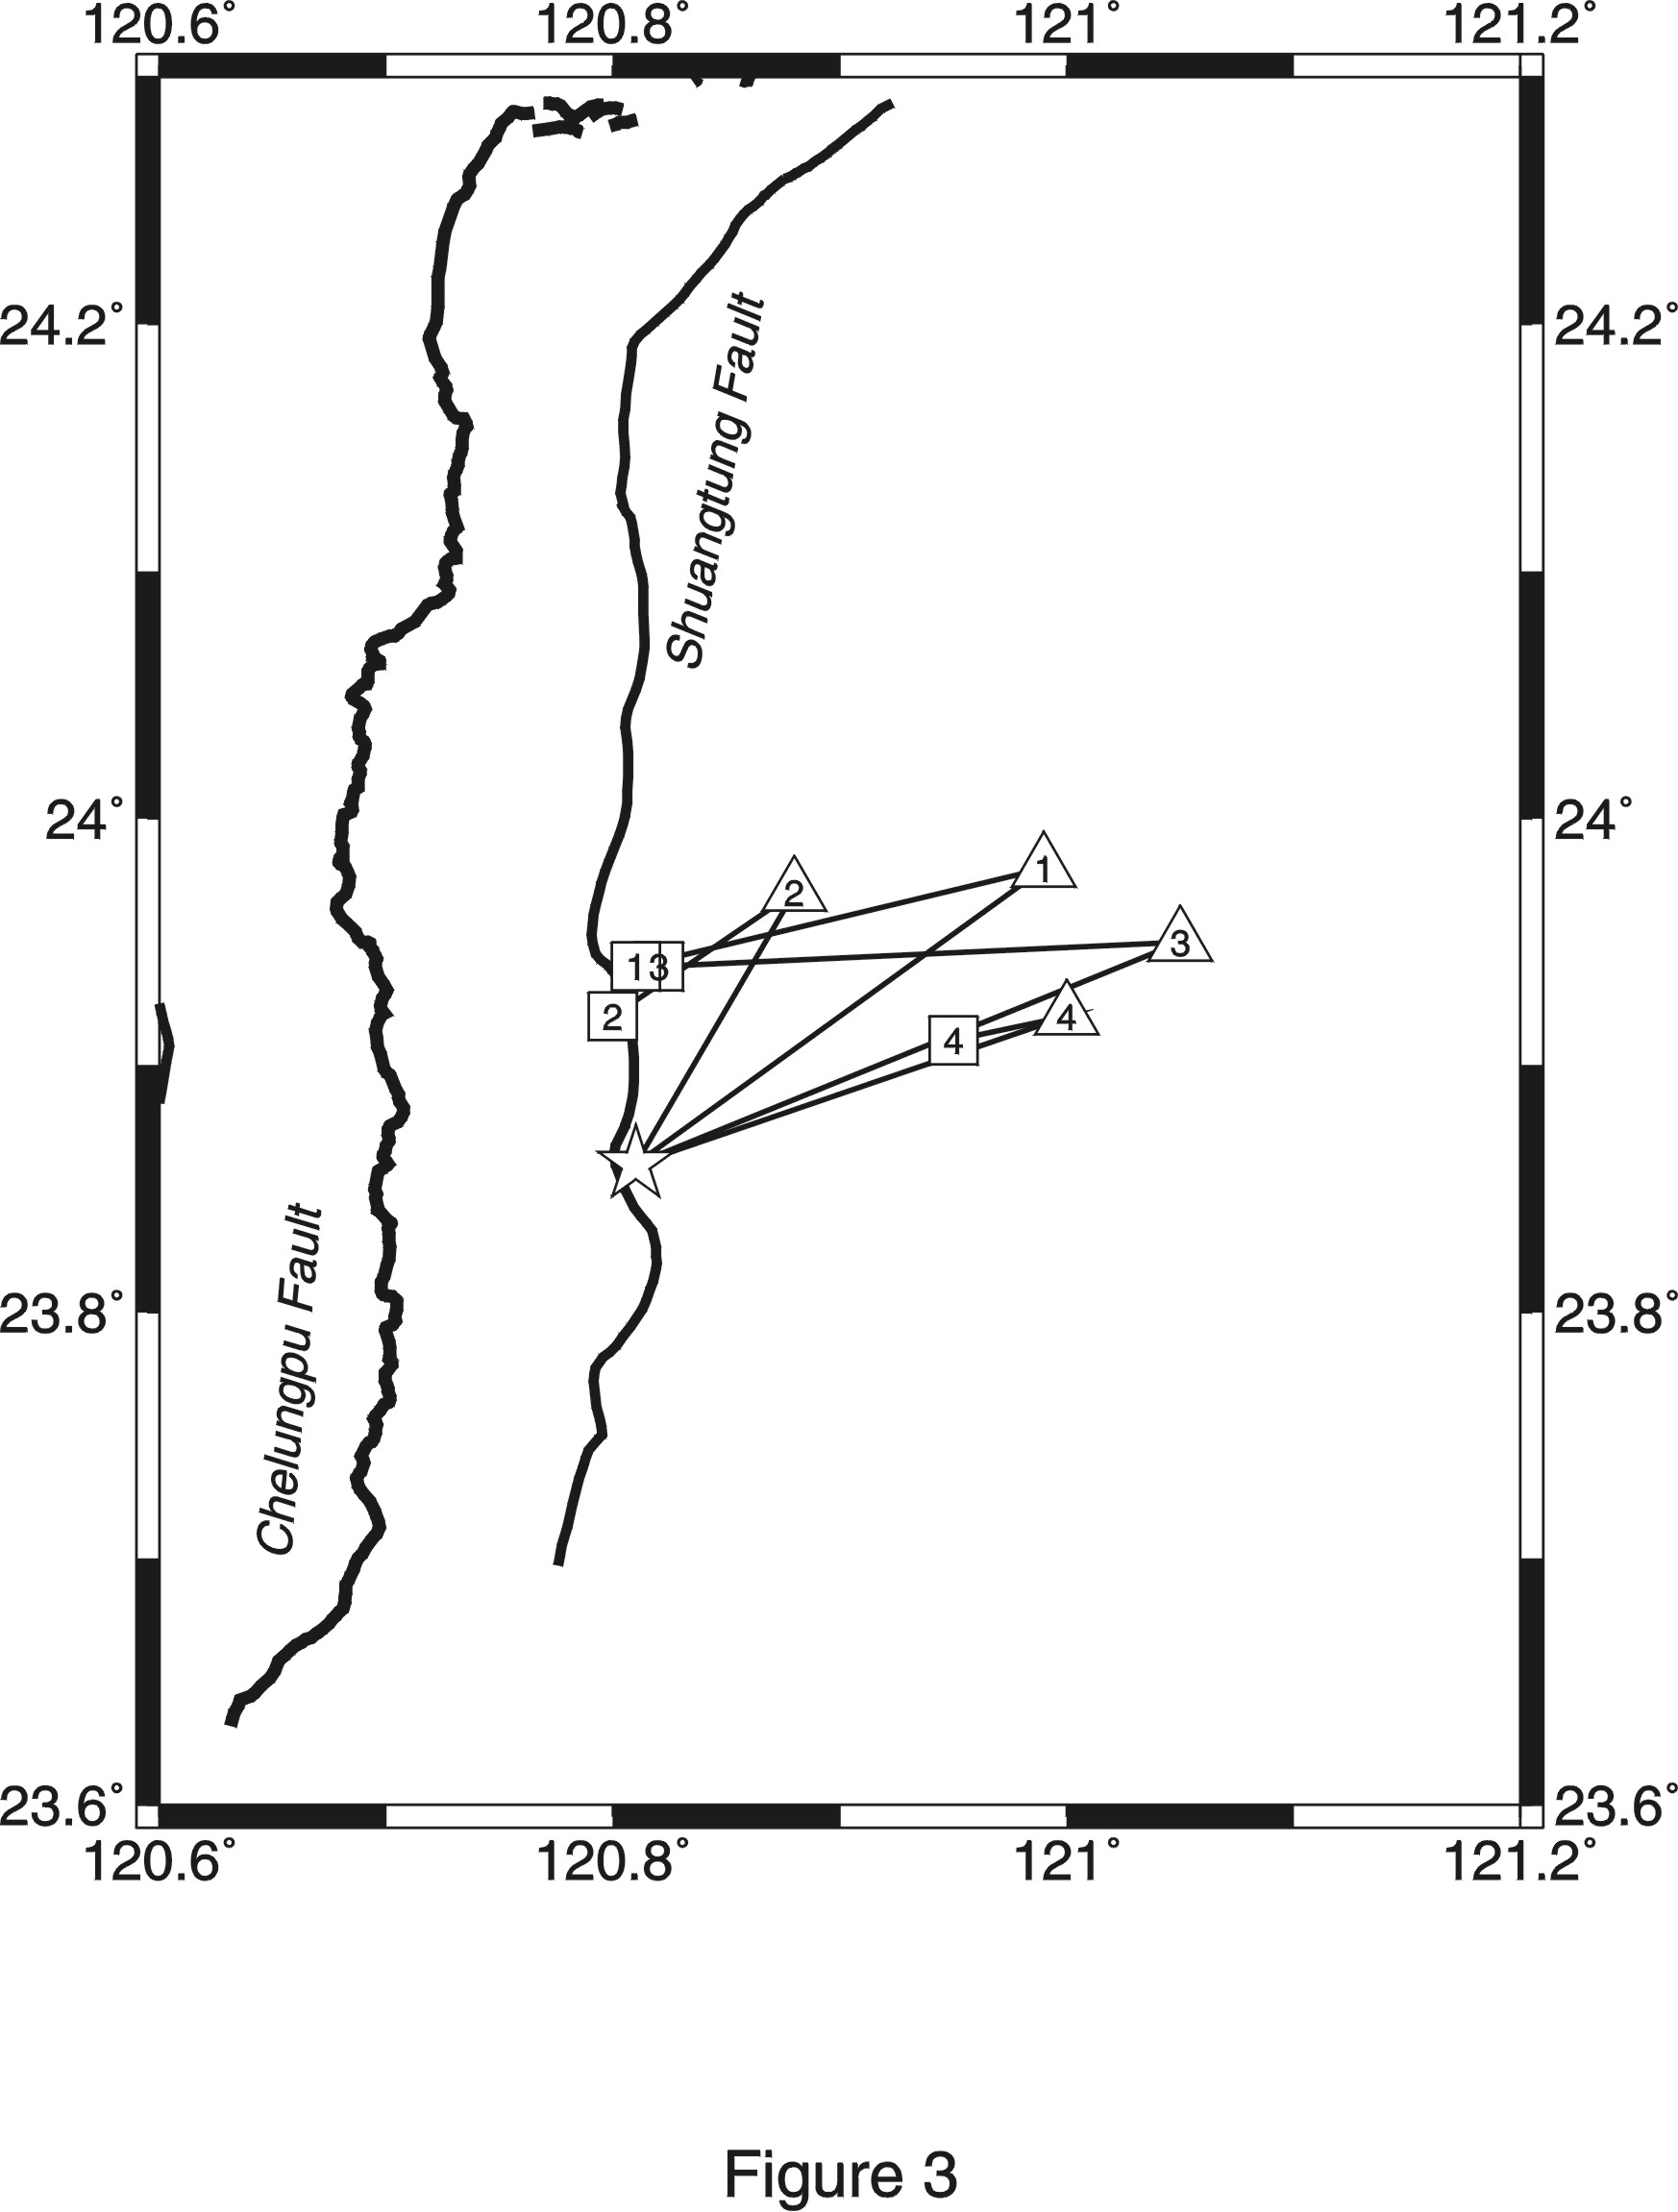
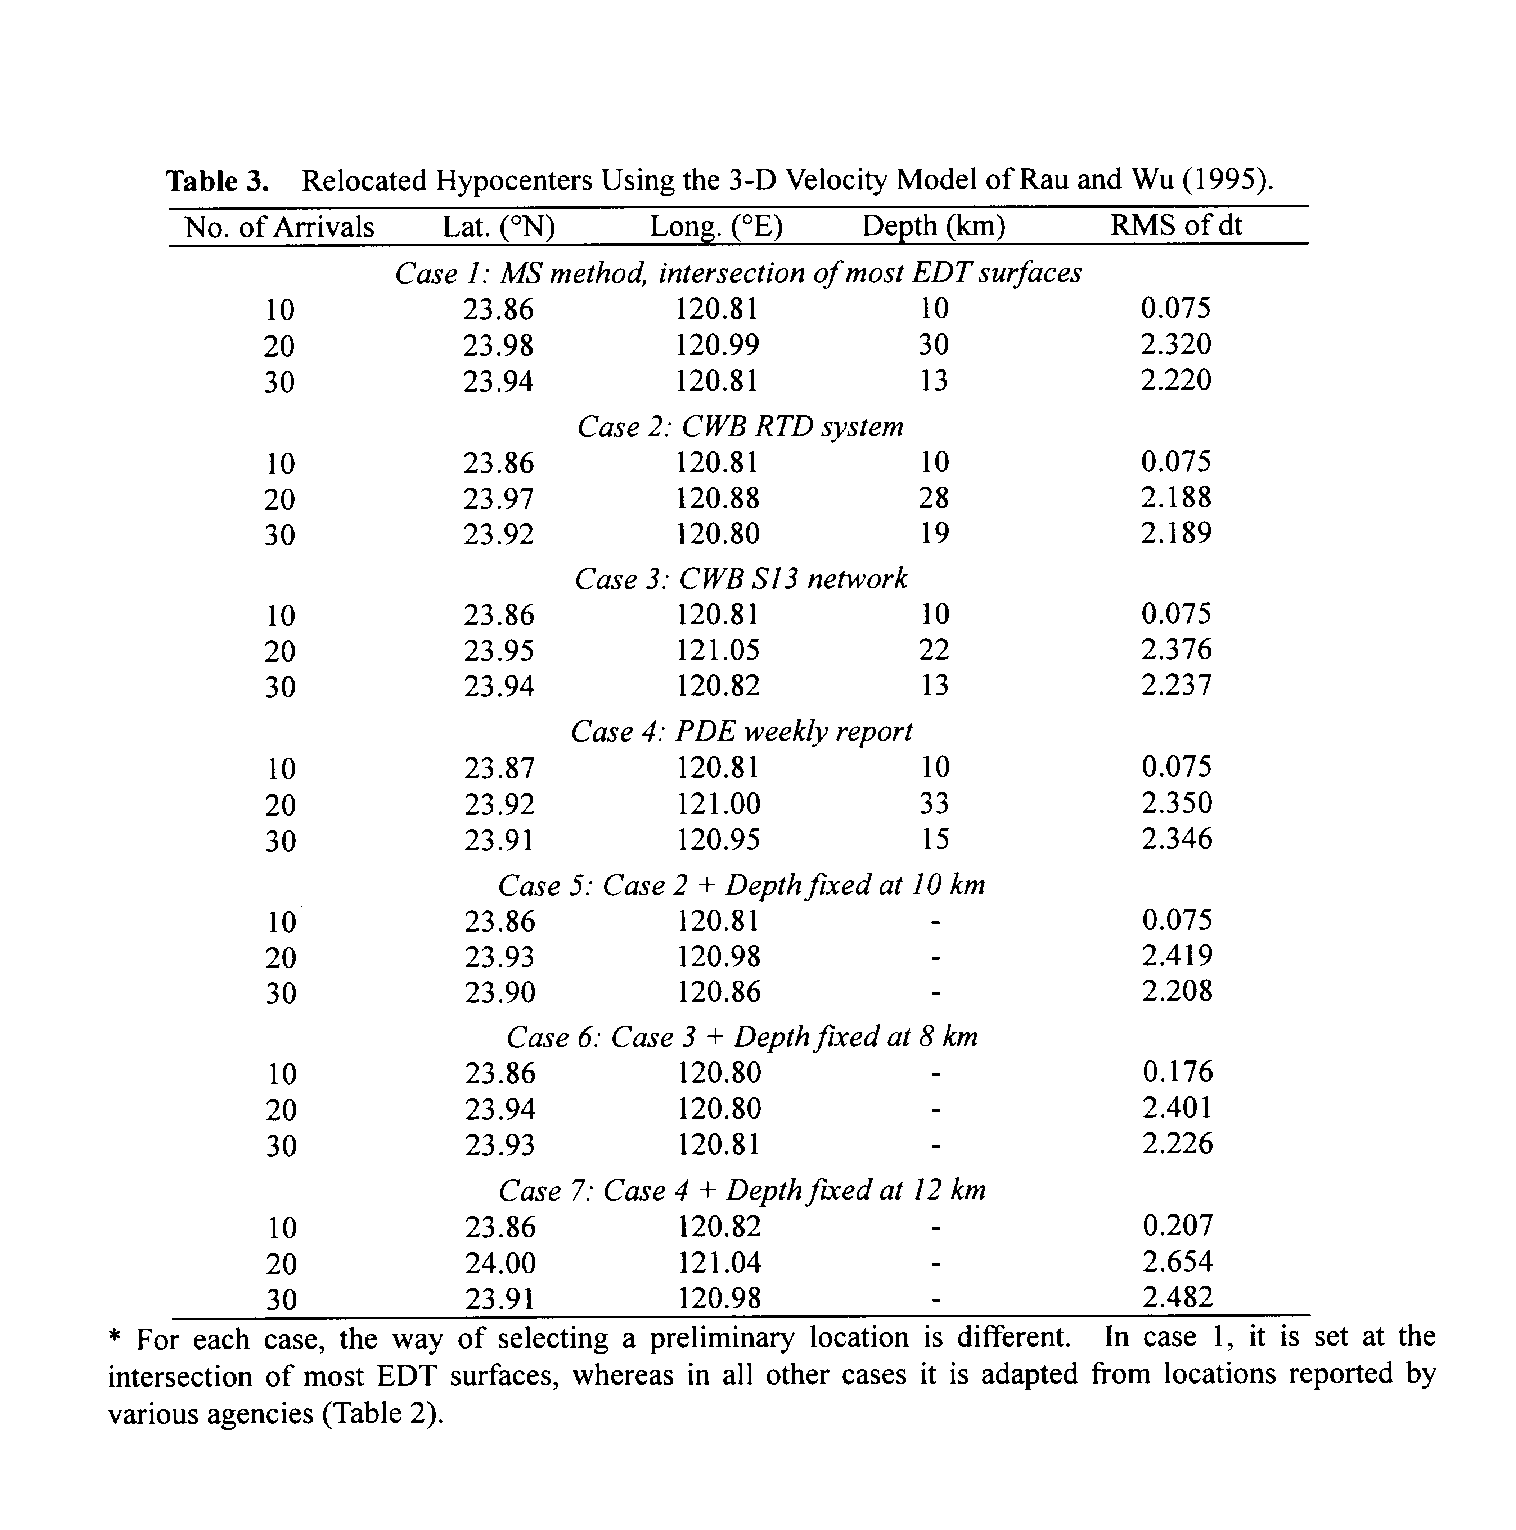
Table 3 and Figure 3 show the results of our 3-D
relocation. Using arrivals from the first 10 stations (SML-NSY, Table
2), the epicenter is located at 23.86°N, 120.81°E, with a depth of
10 km. This epicenter is ~5 km away from that initially reported by the
CWB RTD system, essentially is the same as that in CWB's final report,
but is more than 20 km away from that listed in the PDE weekly report (Table
1). The root-mean-square (RMS) travel time residual between the observed
and synthetics is very small (0.075 s, Table 3),
equivalent to an uncertainty of only 0.5 km. As we increase the number
of arrivals used in the process to 20 and 30, the resulted hypocenters
migrate slightly to (23.98°N, 120.99°E, depth 30 km) and (23.94°N, 120.81°E,
depth 13 km), respectively. Notice that the associated RMS residuals are
significantly higher than that in the previous case (2.32 and 2.22 s, respectively).
Although an increase in the RMS residual is expected when a larger number
of observations is used in the process, such a huge increase (~30 times)
may be, at least in part, due to the discrepancies between the 3-D velocity
model used (Rau and Wu, 1995) and the realistic velocity structure.
Next,
instead of using EDT surfaces to determine the preliminary locations, we
fix it at that reported by the CWB RTD system (i.e., 23.87°N, 120.75°E,
depth 10 km) and perform the finer grid search in the surrounding region.
For the maximum ray numbers of 10, 20, and 30, the hypocenters are located
at (23.86°N, 120.81°E, depth 10 km), (23.97°N, 120.88°E, depth 28 km),
and (23.92°N, 120.80°E, depth 19 km), respectively (Figure
3). If we use the hypocenter determined by the CWB's S13 network (i.e.,
23.85°N, 120.81°E, depth 7 km) as the preliminary location, then the
results remain similar (Table 3 and Figure
3). Finally, we use the hypocenter listed in the PDE's weekly report
as the preliminary location. We obtained again a similar pattern (Table
3 and Figure 3).
In
general, the focal depth is more difficult to constrain than the location
of epicenter because of two reasons. One is the well-known trade-off between
the assumed origin time and focal depth, and the other is the limited resolution
of travel time curves with respect to depth. Thus, another common way to
relocate an earthquake's hypocenter is to set a priori constraint
on the focal depth, if reliable and independent estimates are available,
and invert only for the epicenter (e.g., Kao and Chen, 1996).
Consequently,
we modified the MS program such that the focal depth can be fixed during
the relocation process. We repeat the above three cases with a given depth
at 10, 8, or 12 km, respectively. The results are summarized in
Table 3. It is clear that almost all cases with fixed depths bear higher
RMS residuals than the ones without. Like in previous cases, results using
10 rays show significantly smaller RMS residuals than that using 20 or
more. One important point is that no matter which preliminary location
is used in the process, the final location is always at 23.86±0.01°N,
120.81±0.01°E. However, the ones with focal depths fixed at 8 and 12
km have the RMS residuals much higher (2.3 and 2.8 times, respectively)
than our best solution (i.e., at 10 km; Table 3),
suggesting that the results have sufficient resolution with respect to
the focal depth.
5.
Discussion and Conclusion
From
Table
3 and Figure 3, it is quite obvious that no matter
how the preliminary locations are selected, the hypocenter with the minimum
RMS residual (0.075 s using the earliest 10 arrivals) always converges
to 23.86±0.01°N, 120.81±0.01°E, and depth of 10 km. Such results clearly
indicate that the process is very stable and virtually free from the nonlinear
nature of earthquake relocation. Furthermore, the RMS residual is very
sensitive to both the epicenter and focal depth, implying that the combination
of this dataset and the MS method has sufficient resolution for such a
task.
Generally
speaking, the RMS travel time residual is proportional to the number of
stations used in the relocation. One interesting point in our result, however,
is that solutions using 20 arrivals often have larger RMS residuals than
that using the whole dataset (Table 3). To investigate
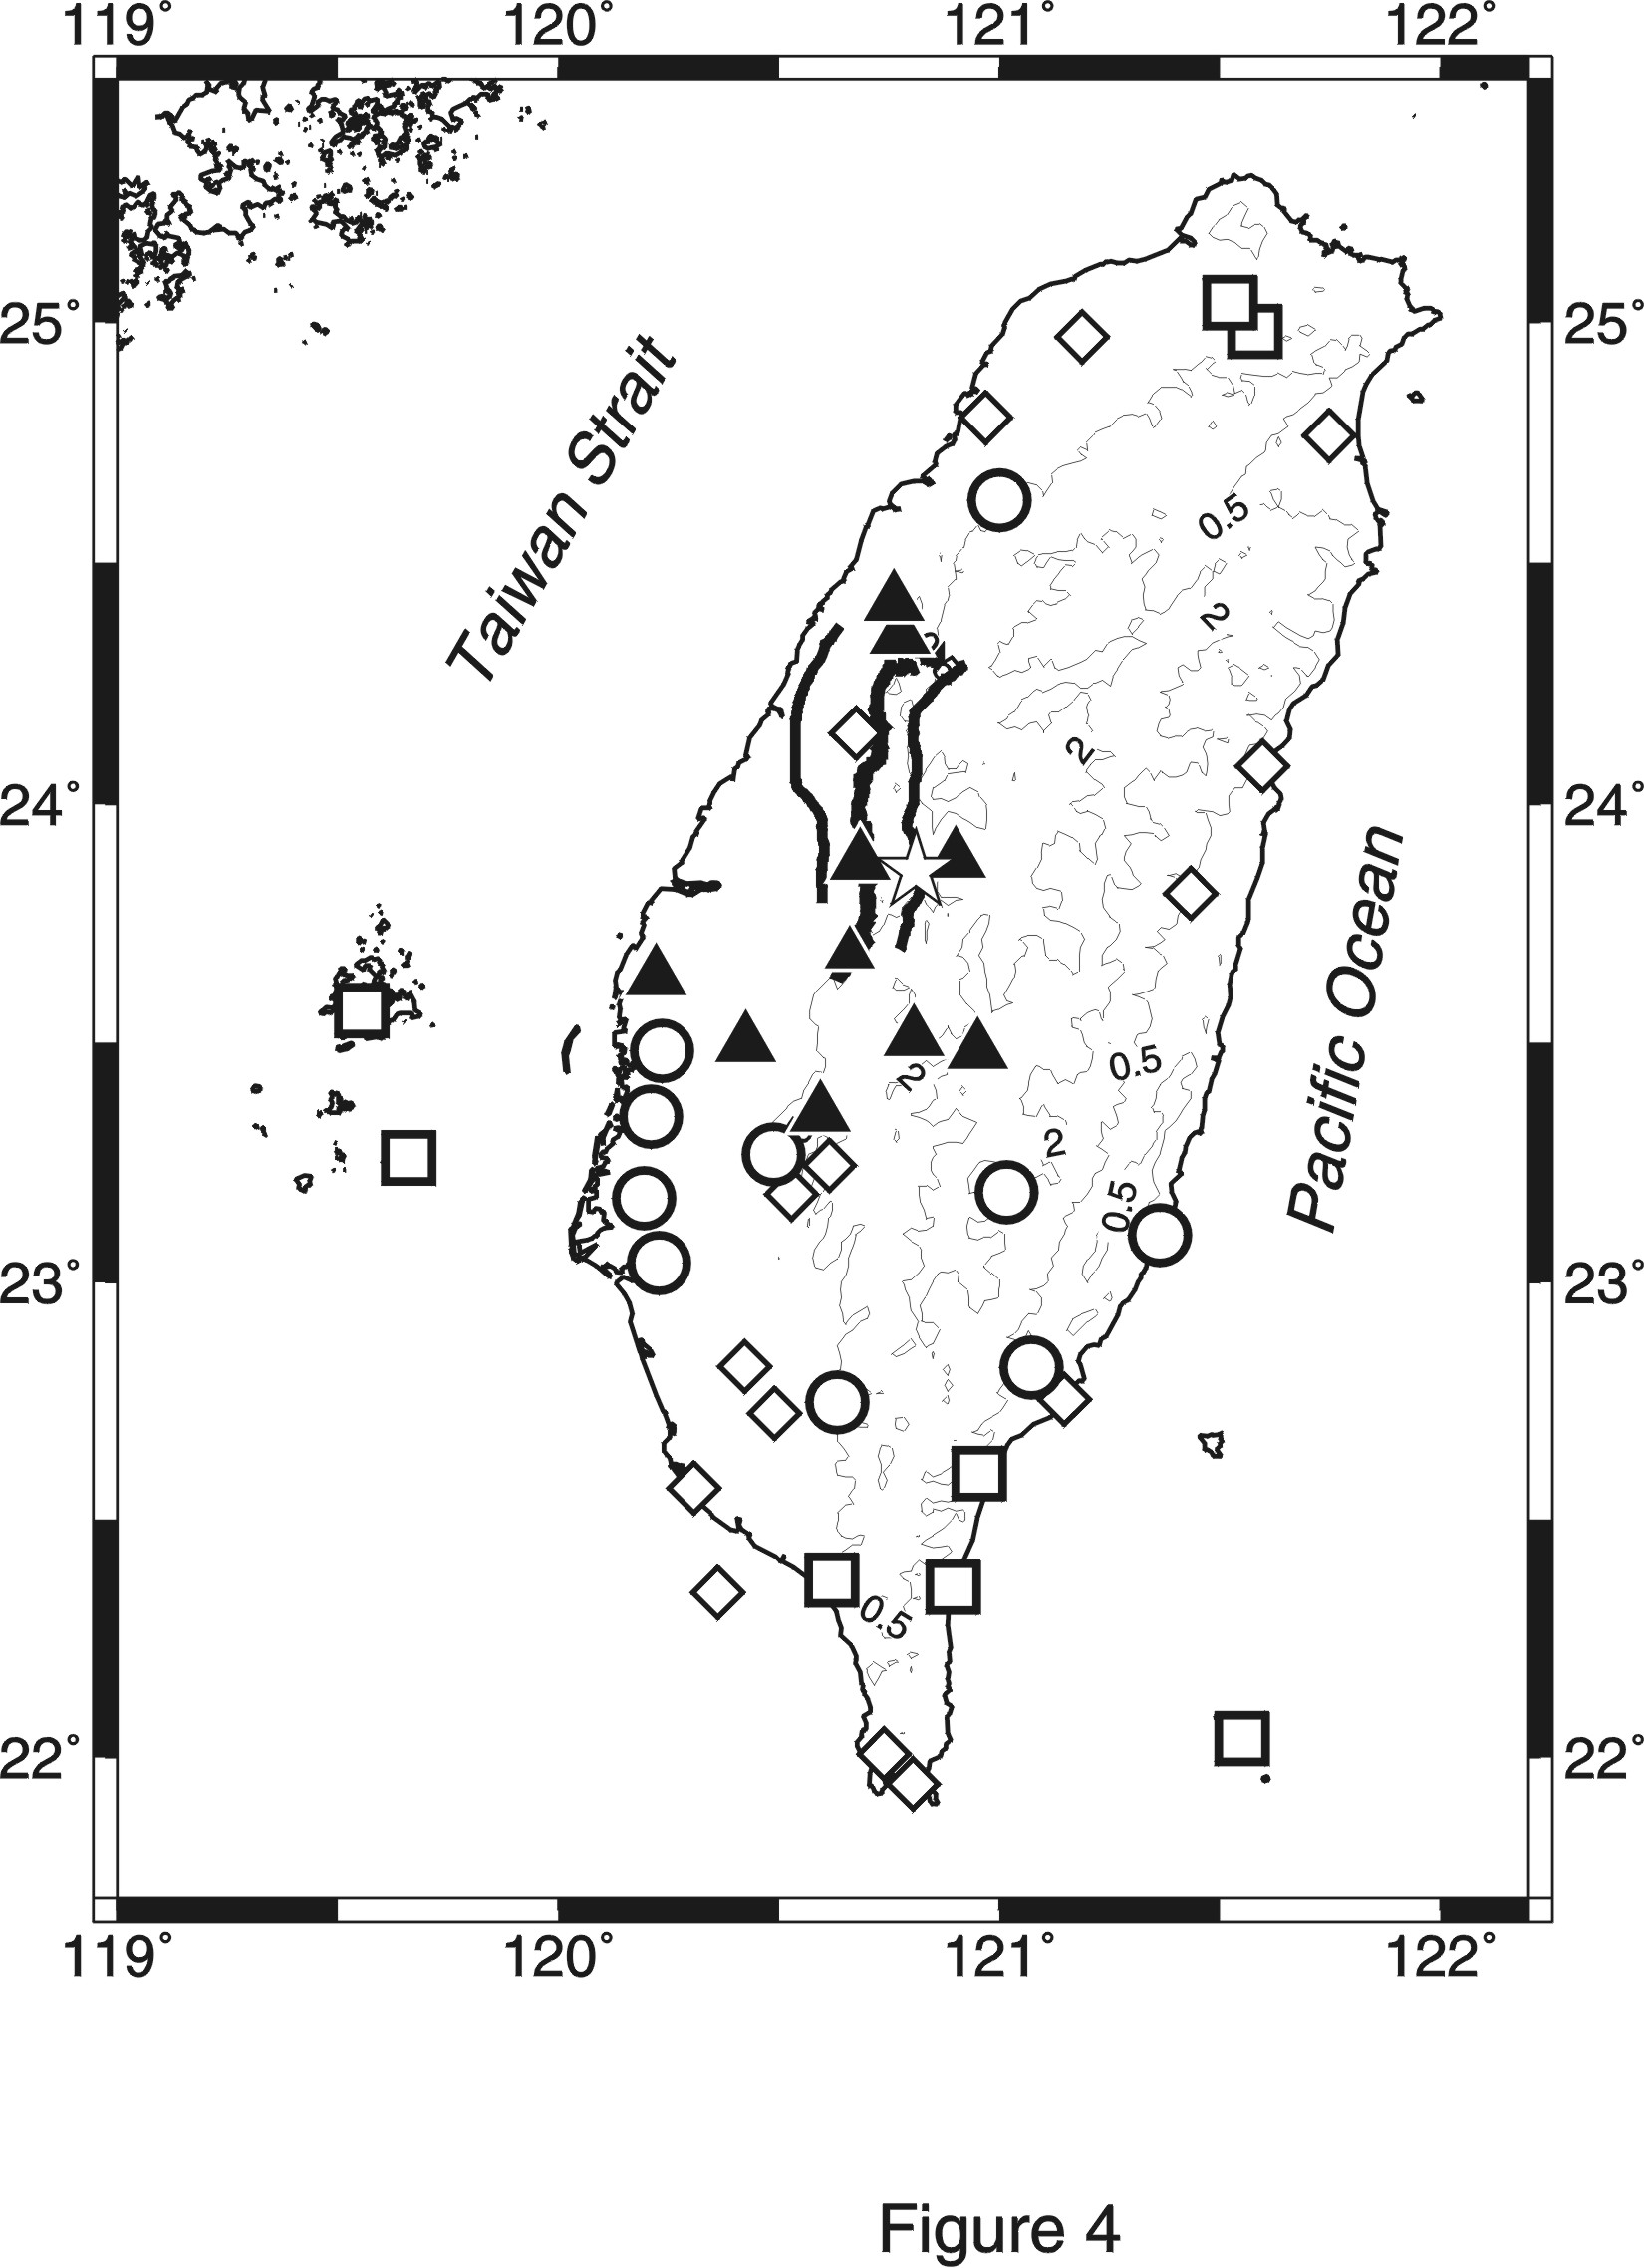
the implications of such a phenomenon, we plot out the distribution of
seismic stations used in various cases in Figure 4.
Clearly, stations of the first 10 arrivals scatter across the central west
Taiwan with distances <65 km (Table 2 and Figure
4). The next 10 stations distribute mostly to the south of the epicenter
between 70 and 124 km, while the complete dataset covers a wide distance
range up to 160 km. It is important to point out that the ray paths connecting
the epicenter to stations at the distance range of ~100 km travel mostly
within the crust where a significant difference is found between the coastal
plain of west Taiwan and the Central Range (Rau and Wu, 1995; Ma et al.,
1996). Therefore, we suspect that the less satisfactory results using 20
arrivals are due to the insufficient resolution of the used 3-D velocity
model for the large lateral variation within the crust. Furthermore, the
better spatial coverage in cases of using 30 stations may also contribute
to the better result (e.g., Tsai and Wu, 1997). Obviously, more detailed
mapping of regional 3-D velocity structures is warranted in the future.
Until a better model becomes available, careful selection of arrival dataset
and repeated forward search perhaps are necessary in the 3-D relocation
of earthquake hypocenters.
Notice
that our best solution is almost the same as that in CWB's final report
(Tables 2 and 3), although
the two results were obtained using completely different approaches. The
CWB's final location is determined from a combined dataset of both arrivals
on short-period seismograms and S-P time intervals on near-source
strong-motion records. An important conclusion of our study is that a reliable
hypocenter can be derived using as few as 10 accurately determined arrival
times from nearby short-period stations, if a reasonable 3-D velocity model
and the MS method are used in the hypocenter determination process. This
implies that the performance of CWB RTD system, which is already the leading
example of its kind, can be further improved in the near future.
Finally,
we conduct a test of relocation using all available arrivals, whether impulsive
or not, to examine if there is any bias in our preferred dataset (Figure
4). It turns out that the best solution always remains the same. Moreover,
the results of various cases (Table 3) show patterns
similar to that presented in Figure 2(i.e., cases using
20 arrivals tend to shift to the east, while cases using 30 tend to shift
slightly to the north), although the exact locations are a little different
from case to case. This result indicates that the relocation is relatively
robust even under the influence of some arrivals that are less impulsive.
6.
Acknowledgement
We
benefit form discussions with W.-P. Chen, J.-C. Lee, M. Kikuchi, K.-F.
Ma, T. Seno, T. L. Teng, and F. T. Wu. Prof. C.-T. Lee kindly provides
the fault traces used in Figures 1, 3, and 4. We also thank Jer-Ming Chiu
and an anonymous reviewer for their constructive comments and suggestions.
The manuscript is written when one of the authors (HK) is in the Earthquake
Research Institute, Univ. of Tokyo, as an invited visiting professor. The
facilities and assistance provided by Prof. Yoshio Fukao and his colleagues
are greatly appreciated. This research was supported by the National Science
Council, ROC, grant NSC 89-2116-M-001 -017 and the Central Weather Bureau,
ROC, grand CWB89-2E-06.
7.
References
Billings,
S.D., Sambridge, M.S. and Kennett, B.L.N., 1994. Errors in hypocenter location:
Picking, model, and magnitude dependence. Bull. Seismol. Soc.Am., 84: 1978-1990.
Chen,
C.-H. and Zeng, Y., 1999. Inversion of the source rupture process of the
September 20, 1999 Chi-Chi, Taiwan, earthquake (abstract), AGU 1999 Fall
Meeting Program: 12.
Chiu,
J.-M., Chiu, S.-C.C. and Kim, S.G., 1997. The significance of the crustal
velocity model in local earthquake locations from a case example of a PANDA
experiment in the Central United States. Bull. Seismol. Soc. Am., 87: 1537-1552.
Christensen,
D.H. and Ruff, L.J., 1985. Analysis of the trade-off between hypocentral
depth and source time function. Bull. Seismol. Soc. Am., 75: 1637-1656.
Dziewonski,
A.M., Chou, T.-A. and Woodhouse, J.H., 1981. Determination of earthquake
source parameters from waveform data for studies of global and regional
seismicity. J. Geophys. Res., 86: 2825-2852.
Kanamori,
H., 1978. Quantification of earthquakes. Nature, 271: 411-414.
Kao,
H. and Chen, W.-P., 1991. Earthquakes along the Ryukyu-Kyushu arc:Strain
segmentation, lateral compression, and the thermomechanical state of the
plate interface. J. Geophys. Res., 96: 21,443-21,485.
Kao,
H. and Chen, W.-P., 1996. Seismicity in the outer-rise-forearc region and
configuration of the subducting lithosphere with special reference to the
Japan trench. J. Geophys. Res., 101: 27,811-27,831.
Kao,
H. and Chen, W.-P., 2000. The Chi-Chi earthquake sequence of September
20, 1999 in Taiwan: Seismotectonics of an active, out-of-sequence thrust.
Science, submitted.
Ma,
K.-F., Wang, J.-H. and Zhao, D., 1996. Three-dimensional seismic velocity
structure of the crust and uppermost mantle beneath Taiwan. J. Phys. Earth,
44: 85-105.
Ma,
K.-F., Song, D.-R. and Mori, J., 1999. Teleseismic and near source motion
investigation of the September 20, 1999 Chi-Chi Taiwan earthquake (abstract).
AGU 1999 Fall Meeting Program: 12.
Moser,
T.J., 1991. Shortest path calculation of seismic rays. Geophysics, 56:
59-67.
Rau,
R.-J. and Wu, F.T., 1995. Tomographic imaging of lithospheric structures
under Taiwan. Earth Planet. Sci. Lett., 133: 517-532.
Sacks,
I.S. and Rydelek, P.A., 1995. Earthquake "quanta" as an explanation for
observed magnitudes and stress drops. Bull. Seismol. Soc. Am., 85: 808-813.
Shin,
T.C., Kuo, K.W., Lee, W.H.K., Teng, T.L. and Tsai, Y.B., 2000. A preliminary
report on the 1999 Chi-Chi (Taiwan) earthquake. Seismol. Res. Lett., 71:
23-29.
Sipkin,
S.A., 1982. Estimation of earthquake source parameters by the inversion
of waveform data: synthetic waveforms. Phys. Earth Planet. Inter., 30:
242-259.
Tsai,
Y.-B. and Wu, H.-H., 1997. A study of the errors in locating earthquakes
due to the geometry of the Taiwan seismic network. Terr. Atmos. Oceanic
Sci., 8: 355-370.
Wu,
Y.-M., Shin, T.-C. and Tsai, Y.-B., 1998. Quick and reliable determination
of magnitude for seismic early warning. Bull. Seismol. Soc. Am., 88: 1254-1259.
Zhou,
H.-W., 1994. Rapid three-dimensionaal hypocentral determination using a
master station method. J. Geophys. Res., 99: 15,439-15,455.
Figure 3. Results of
relocation using the 3-D velocity model of Rau and Wu (1995). Different
symbols represent results using ifferent numbers of arrivals in the process:
star, triangle, and square for the maximum number of 10, 20, and 30 arrivals,
respectively.Each set of star, triangle, and square connecting by straight
lines are results with the same preliminary location, corresponding to
various cases listed in Table 3. Notice that regardless of the initial
conditions, the best solution always converges to the same location (the
star).
Figure 4. Map showing the distribution of seismic stations whose arrival times are used in this study (Table 2).Stations with impulsive arrivals are shown in solid triangles (1-10), open circles (11-20), and open squares (the rest) according to their arrival times. Stations with less impulsive arrivals are marked by smaller diamonds.

