Click
on beach-balls to see the related information. Please also see the figure caption
below this map.
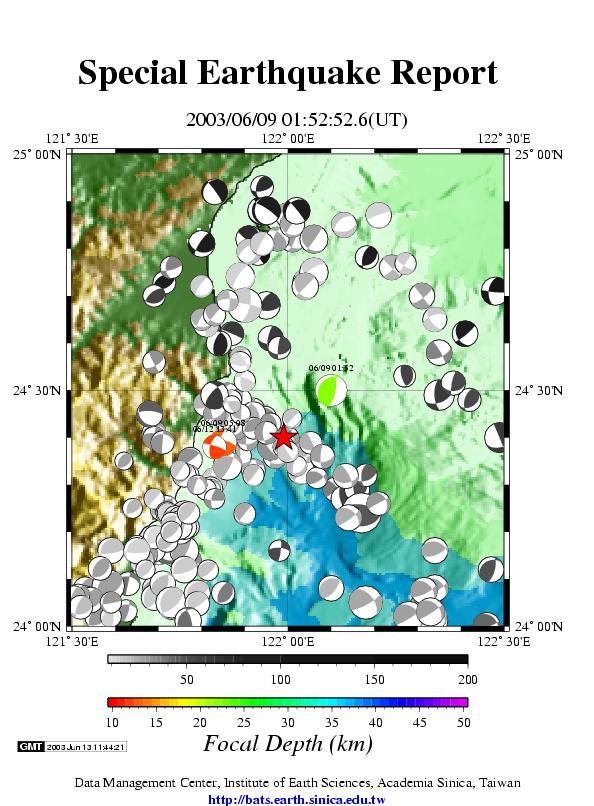
Figure Caption:
Beach-balls with gray color denote historic focal mechanisms that determined
by inverting BATS waveform data since July, 1995, whereas the color beach-balls
indicate either the main shock or aftershocks of the 06/10 08:40 event. Both
gray and color scales present the corresponding centroid focal depth of each
event.